Ask with context
- Plain-English questions and read-only analytical queries
- Tables, charts and short business insights
- Assumptions explained and ambiguous wording clarified
- Source fields and visible trust scores for returned results
May we use Statcounter to understand visits and improve this website? It receives visit and device information and may store analytics cookies. Your choice is remembered for 180 days. Analytics privacy details.
 AICowanDATA. INTELLIGENCE. CLARITY.
MEET ZENTARRA 4.5
Explore governed definitions, visible result checks and reusable reporting in Zentarra, the AI analytics product developed and sold by AICowan.
WHY ZENTARRA?
Zentarra brings plain-English questions, governed business definitions, visible result checks and reusable analyses into one workflow. It is designed for reporting questions you need to return to, with context to help you judge the answer.
This illustrates the workflow, not a product screenshot. Available features depend on your beta workspace; a trust score is not a guarantee of correctness.
AVAILABLE IN ZENTARRA 4.5
Explore Zentarra through the free beta, with support to get started. Your invitation confirms the features and configuration available in your workspace.
These are product capabilities, not a promise that every feature is enabled in the free beta. Under the default beta policy, saved queries, dashboards and reports cannot be shared. Confirm available save, dashboard, scheduling and export features in your invitation.
Trust scores reflect the configured checks, including semantic governance, executed results, field coverage and joins. They help you assess an answer alongside data-quality information. A score is not a probability of correctness or a guarantee that the result is suitable for a business decision.
DATA CONNECTIONS
Azure SQL Database is the currently proven production and demonstration connection.
Azure SQL Database Proven connectionADDITIONAL CONNECTORS · SUBJECT TO VALIDATION
Connector implementations are available subject to validation. The free beta uses synthetic business data supplied by AICowan; connecting your own database is outside the beta offer.
ZENTARRA PRODUCT TOUR
Take a guided tour of the Zentarra workspace and explore its analytics, reporting and dashboard features.
See the product before applying for the free beta. Zentarra is in development; the interface and available features may change.
Click Play to load YouTube’s player and connect to YouTube. The thumbnail is hosted on this website.
Watch on YouTube ↗ (opens in a new tab)INSIDE ZENTARRA
See Zentarra in action: return costs grouped by reason, a visual comparison, and the supporting figures together in one workspace.
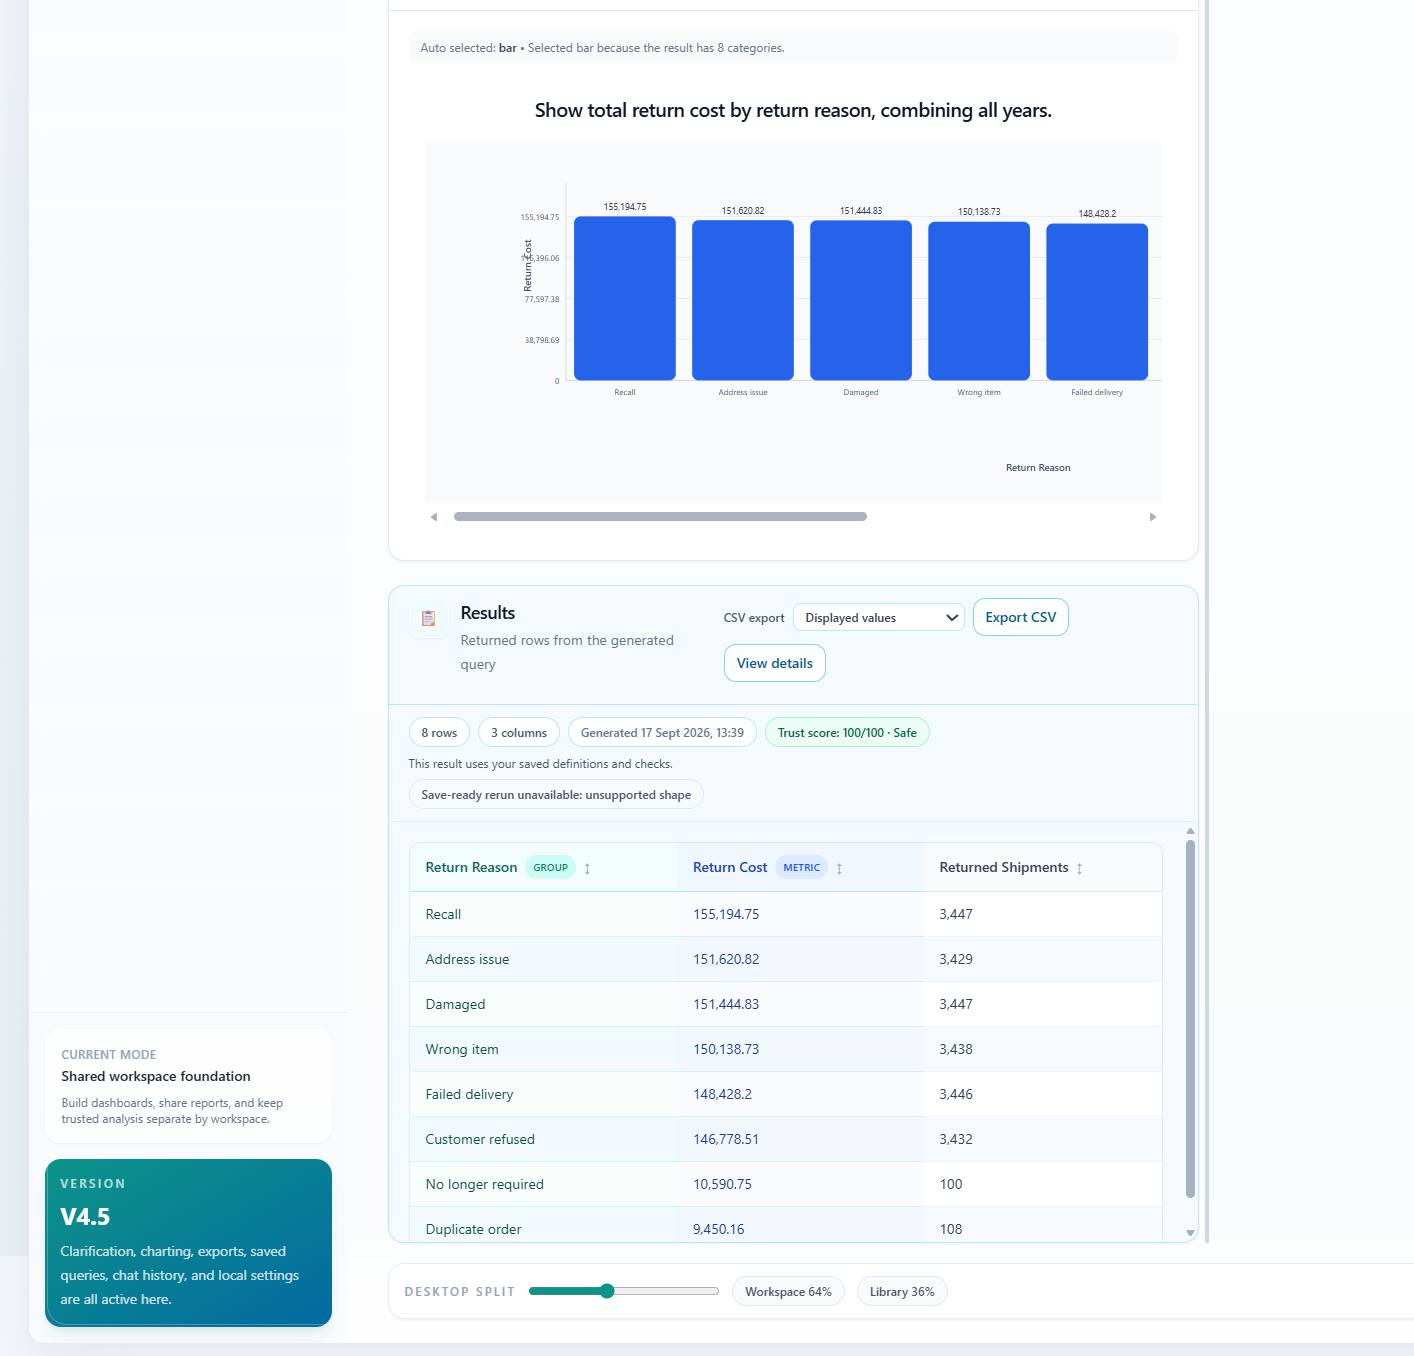
Zentarra V4.5 answers: “Show total return cost by return reason, combining all years.” The result has eight rows and three columns. A bar chart compares return costs; further categories are available through its horizontal scrollbar in the captured application.
| Return reason | Return cost | Returned shipments |
|---|---|---|
| Recall | 155,194.75 | 3,447 |
| Address issue | 151,620.82 | 3,429 |
| Damaged | 151,444.83 | 3,447 |
| Wrong item | 150,138.73 | 3,438 |
| Failed delivery | 148,428.20 | 3,446 |
| Customer refused | 146,778.51 | 3,432 |
| No longer required | 10,590.75 | 100 |
| Duplicate order | 9,450.16 | 108 |
The captured result displays “Trust score: 100/100 · Safe” and says it uses saved definitions and checks. This describes the captured checks, not a guarantee of correctness. It also reports “Save-ready rerun unavailable: unsupported shape”.
The interface shows a displayed-values CSV option, Export CSV and View details controls. These are part of the static screenshot, not interactive controls on this website.
DASHBOARD BUILDER
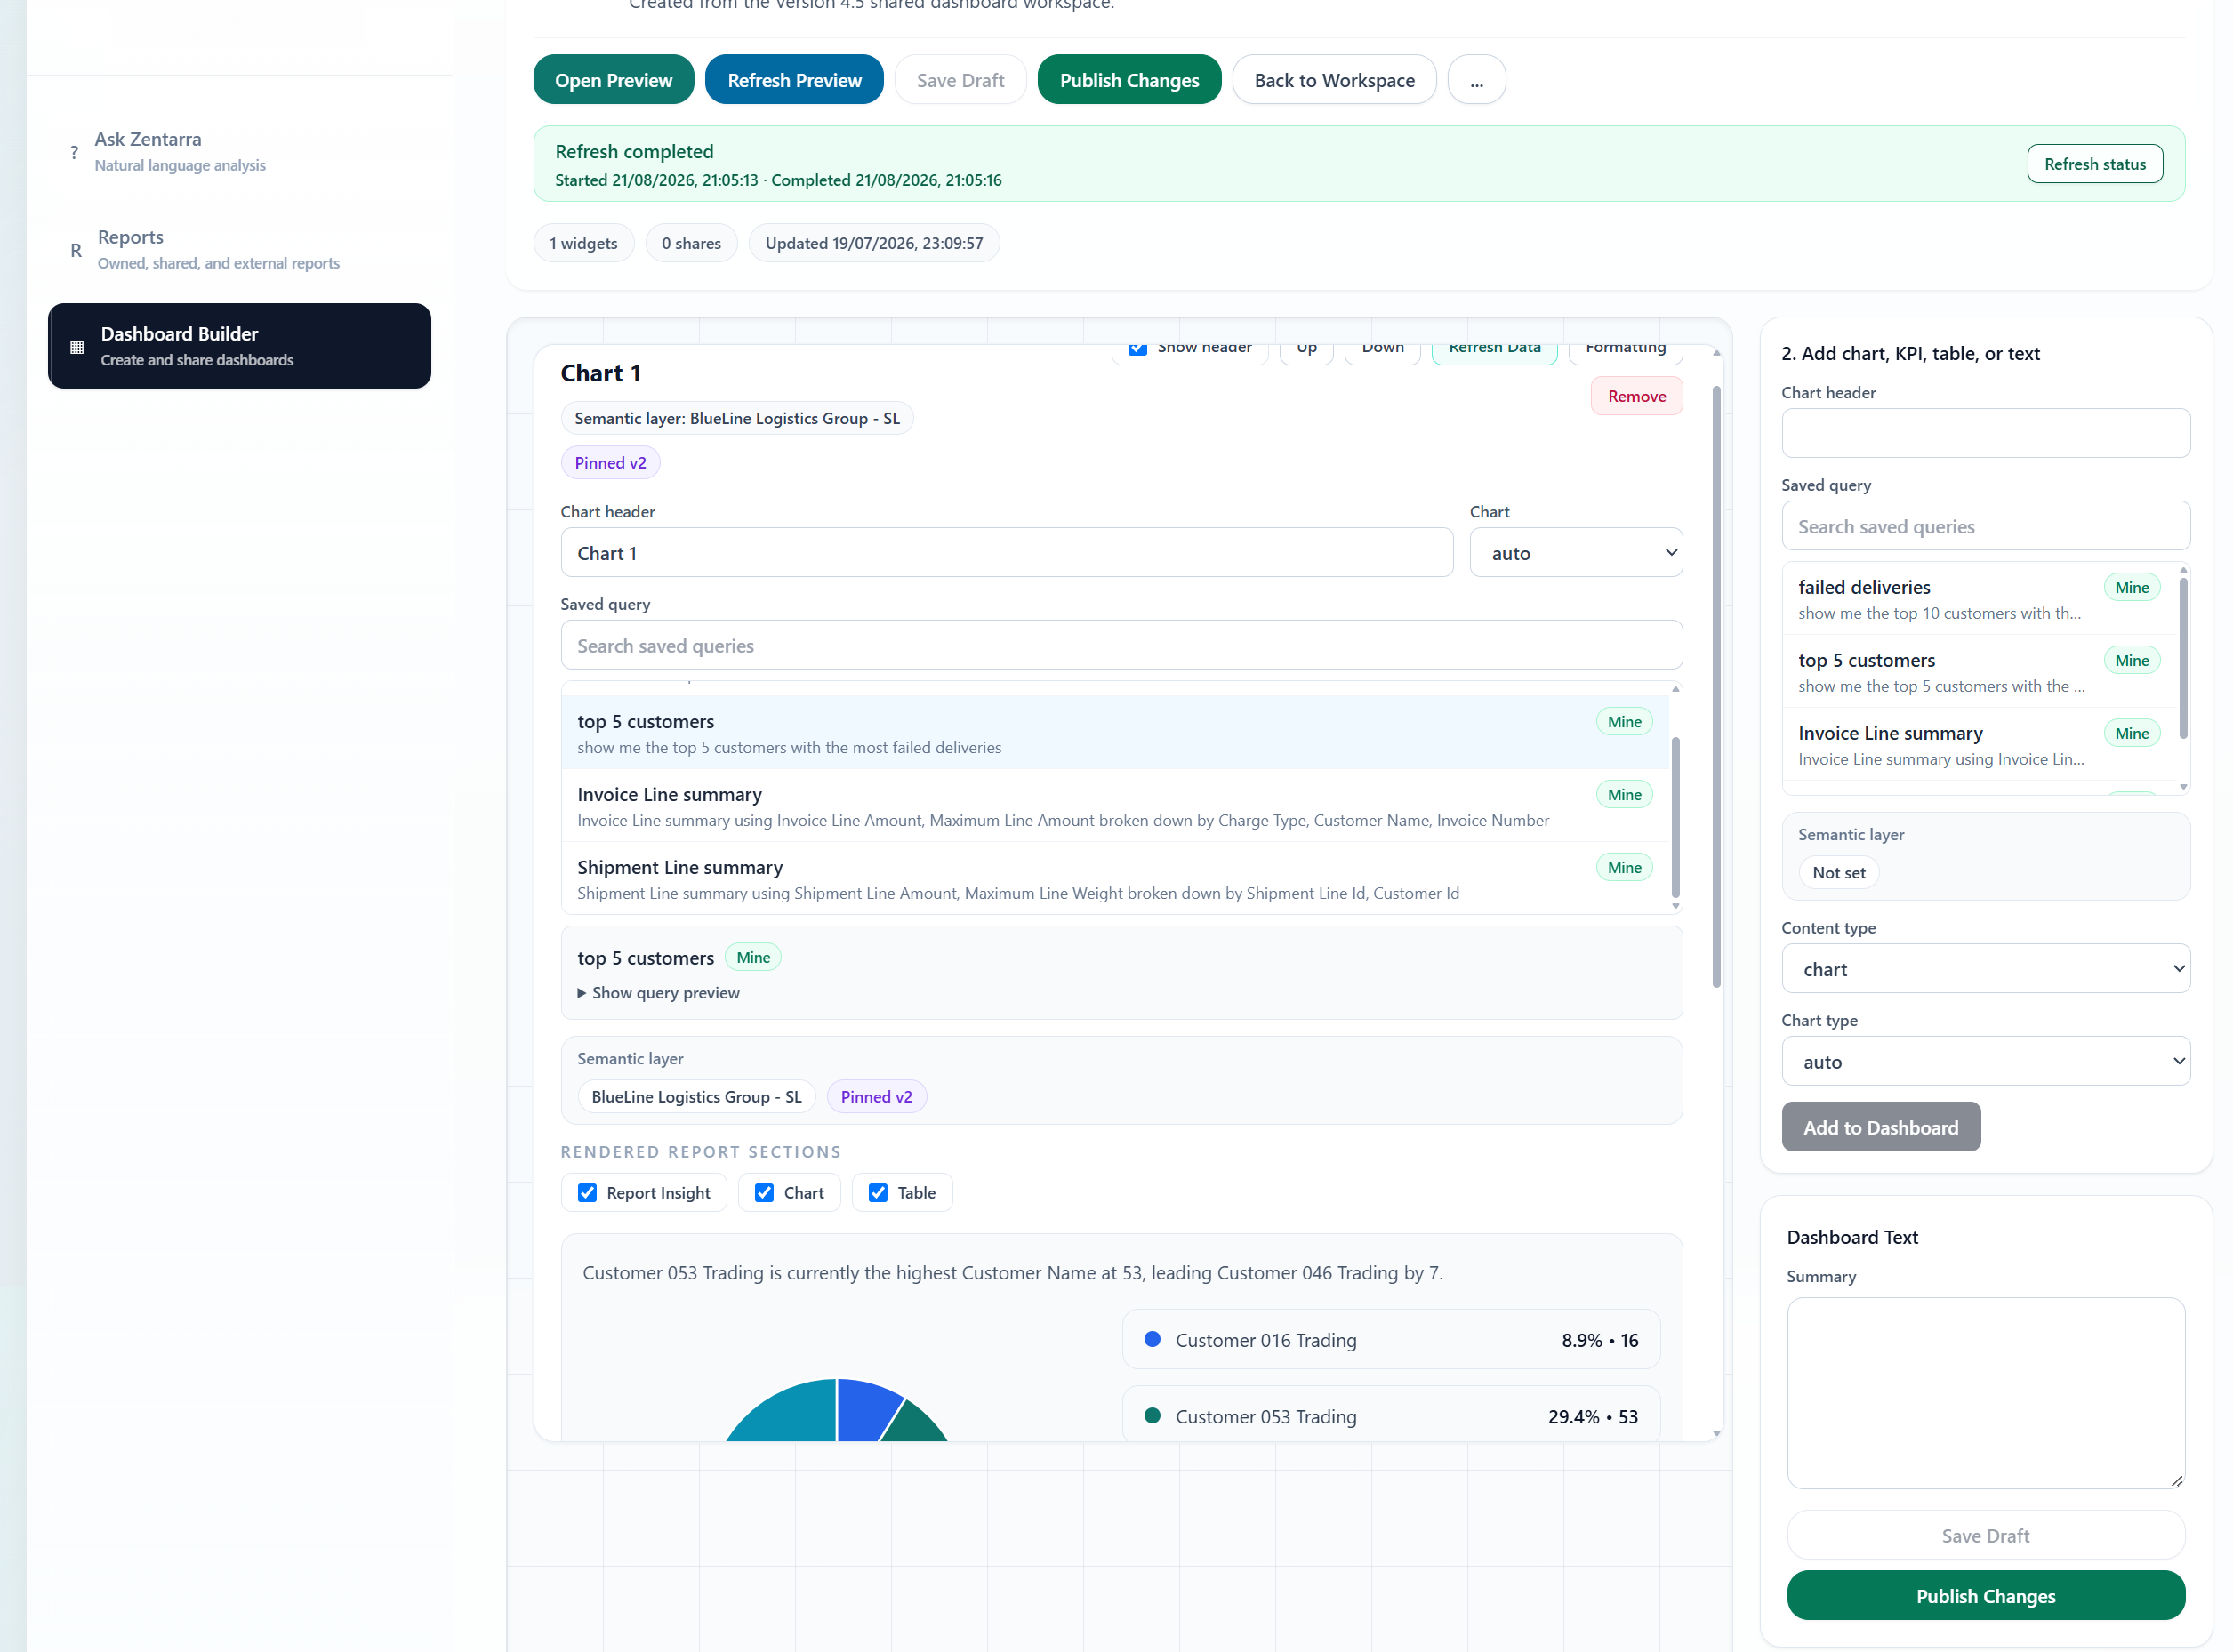
Choose a saved query, configure its chart and select the report sections to display. The builder brings your analysis and presentation settings into one workspace.
A LITTLE CURIOSITY GOES A LONG WAY
From the big picture to the next detail, start with the questions that matter to your business.
REVENUE AT A GLANCE
Compare performance over time and use the underlying query to understand what went into the calculation.
Illustrative figures. This website does not query live business data.
YOUR NEXT QUESTION COULD CHANGE THINGS
Applications are reviewed before beta access is confirmed.